Let’s learn how to measure ASO organic installs in Apple iTunes Connect and Google Play Console
Getting an insight about where do most of your users come from is crucial for developing a user acquisition strategy and finding out where to focus your attention when optimizing the marketing strategy. Finding out and studying this data can be handled in many ways, and the most common one so far has been a use of mobile attribution partners – trackers like AppsFlyer, Adjust, Tune and others, or integrating Google Analytics. But few developers actually know that now this very useful information is also accessible directly from their developer consoles.
In this article we will talk about how to find and separate organic sources of traffic from non-organic in iTunes Connect and Google Play Console. Let’s see whether our ASO strategy is working, or not!
Table of Contents
How to measure ASO organic installs in Apple iTunes Connect
It has been a while since Apple has introduced Search Ads, and since its launch we have all been expecting more information revealed by the stores. And here it comes – since this May Apple is revealing app discoverability data and adding it to App Analytics.
How to find this data:
- Login to your iTunes Connect account.
- Go to App Analytics section and select the app you want to track.
- Select Sources tab:
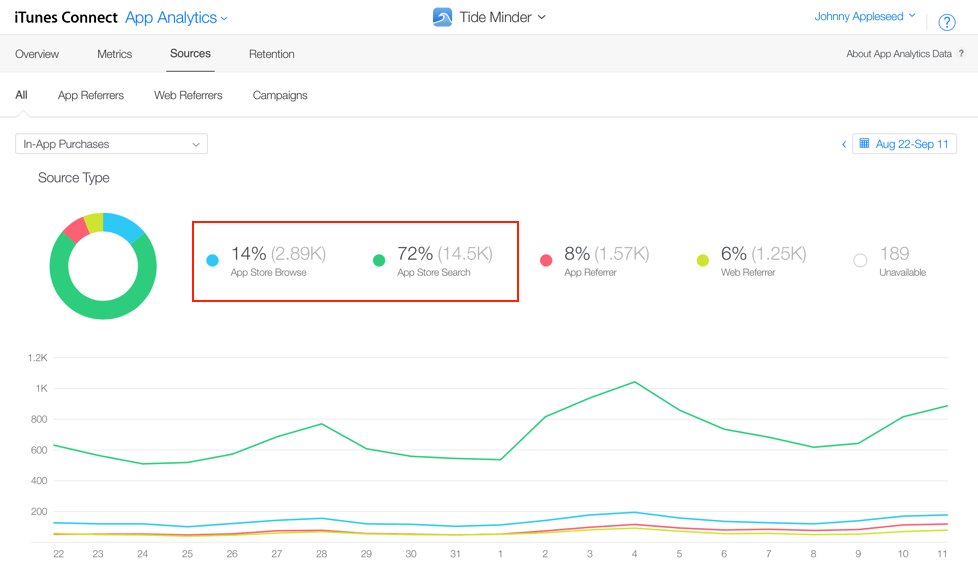
Organic sources of app discovery:
- Apple Store Browse – browsing the Featured, Categories, or Top Charts sections of the App Store.
- Apple Store Search – search queries on the App Store, including Apple Search Ads.
App and Web Referrers, and Campaigns are the non-organic traffic sources that you can also break down with App Analytics Sources section, for example, view Top App or Web Referrers for a selected metric. Campaigns are used to generate campaign links that can be used for promotion, advertising and other marketing materials. The data for Top Campaigns will appear when at least 5 units are attributed to this campaign.
Key metrics
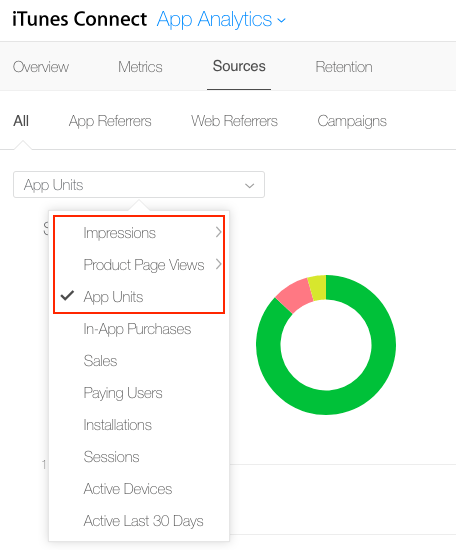
The most important metrics that marketers can monitor for each source of traffic, are:
- Impressions – the number of times an app has been shown, without visualizing listing.
- Product Page Views – the number of visualizations of store listing.
- App Units – the number of actual installs.
Those are the key metrics to analyze when it comes to optimizing visibility, discoverability and conversion rate of a mobile app or game, the basis of ASO strategy. However, at the point of optimizing the sales funnel, you will need the data for other metrics, such as In-App Purchases, Sales, Paying Users, etc.
App Analytics Overview
Apart from measuring organic traffic and analyzing top sources of discoverability, App Analytics provide much more data that is valuable for developers. In Metrics tab the data about usage can be found, including Installations, Sessions, Active Devices, Active in Last 30 Days, and Crashes, for a selected period of time.
With this data you can measure your retention, such as the number of active devices on day X of retention period compared to the number of active devices during the entire period. The tab Retention provides this data with a possibility to break it down per version, device, geo, and source type.
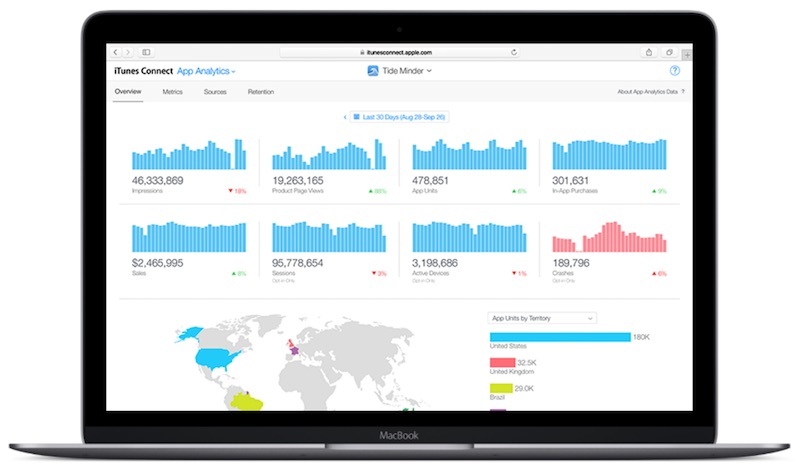
Therefore, you can make conclusions on the top performing sources of traffic in terms of retention, usage, discoverability and sales, and download any of the reports in CSV format, without leaving your developer console!
Read more about the insights you can get in your iTunes Connect here.
How to measure ASO organic installs in Google Play Console
Google is a renowned expert in all sorts of analytics that Android developers can benefit from, and long ago has implemented the insights for User Acquisition that help understanding the main sources of traffic for retained installers and buyers.
How to find this data:
- Login to your Google Play Console account.
- Select the app you want to analyze.
- Go to User Acquisition > Acquisition Reports:
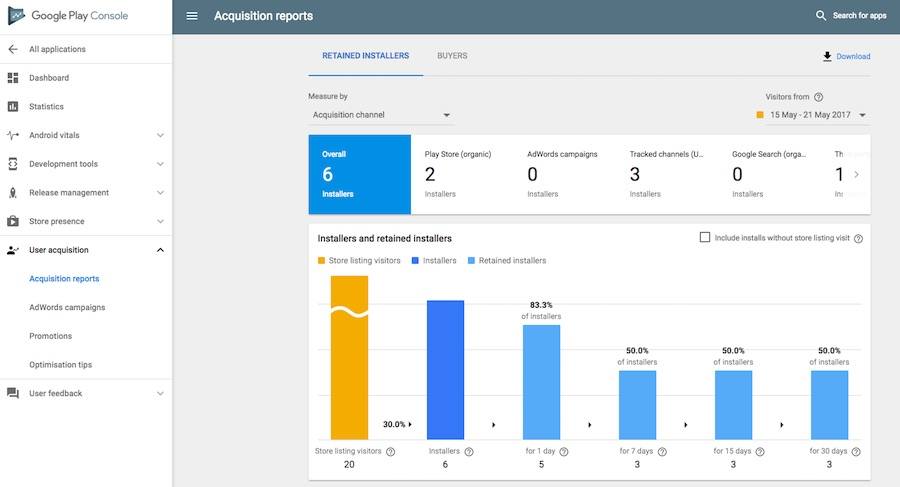
Organic sources of app discovery:
- Google Play Store – browsing the Featured, Categories, or Top Charts in Google Play Store, or searching in the Play Store.
- Google Web Search – search queries directly in Google web search.
There are also other user acquisition channels to track, in case of Google they are separated for AdWords campaigns, other Tracked channels (UTM-tagged links to Play Store), and Third-party referrers, including web and app referrers.
Key metrics
Similarly to App Store, Google Play Store gives out an information about these 3 key metrics to monitor for app discovery, conversion funnel and retention:
- Store listing visitors – a number of people who have viewed an store listing in Google Play Store.
- Installers – a number of users who have installed an app (after viewing store listing).
- Installs without store listing visit – to activate this metric, just tick the box to include it, that is located in the right corner of Installers and Retained Installers chart. It will show unique users who have installed an app without visiting its Play Store listing, or had the app pre installed.
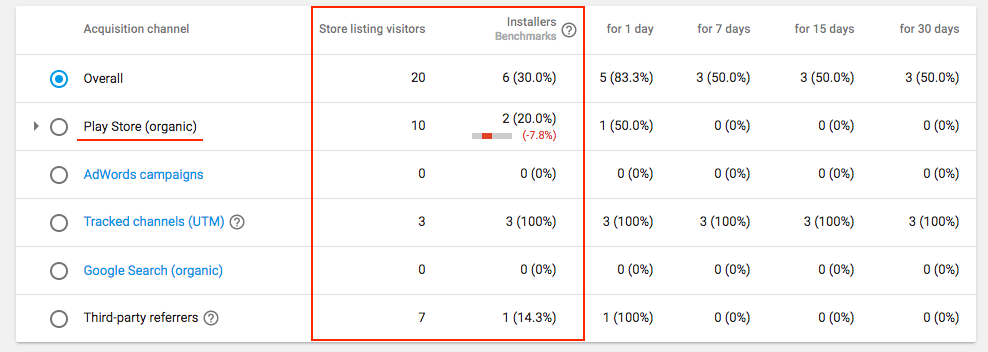
In Google Play Console, store listing visitors and installers differ from “clicks” and “conversions” reported on AdWords. If a user visits or installs your app multiple times, it will be only counted once on the Play Console.
Google Play Acquisition Reports overview
You can break down the retained installers or buyers not only by the acquisition channels, that we have looked into earlier, but also per country for all traffic types, and for country only for organic Google Play Store traffic.
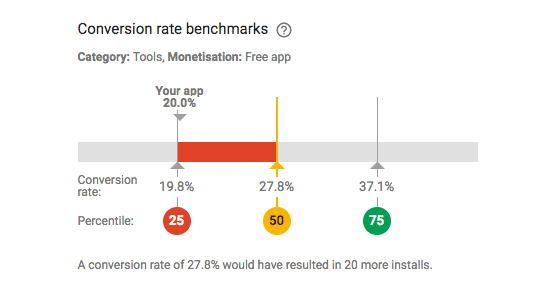
Set “Measure by” to Country (Play Store Organic) to view the conversion rate benchmarks for your app in its category and monetization type (free or paid). The app will be then compared to similar apps in terms of the conversion rate, and you can get an estimation of how many more installs you can get if you improve your conversion rate.
Read more about how to identify your valuable users and and optimize your traffic sources in this User Acquisition Best Practices by Google.
Measuring ASO organic installs: conclusions
Identifying your most valuable users and customers is the key to understanding your app and creating the roadmap of marketing actions. This vital information is now included in both Google Play Console and iTunes Connect, however, to break down the metrics down even more per keywords, or compare your app with your real ASO competitors, in-depth detailed ASO tools will be more helpful.
Which tools are you using for analyzing and getting deep insights about the traffic sources of your app? Tell us in the comments!
Liked the article? Share it with your friends and colleagues – thanks in advance!

10 thoughts on “How to measure ASO organic installs in iTunes Connect and Google Play Console”
thanks for this post is very nice
Thank you! 🙂
I like how you made something that is black box ish , easy to understand and do. Thanks Kat. V
Thank you Vijay! Happy to hear you liked it 🙂
Thanks for the article. Is Apple Store Search source type both an organic and paid measure of impressions, taps, and app units? I’m looking for a way to measure Search Ads activity within iTunes Connect.
Hi Philip,
Indeed, iTunes Connect has the data for both organic and paid sources. You would need to measure Apple Search Ads activity in the ASA dashboard and then (Search-ASA) would give you the organic results.
Hope this helps 🙂
That being said, is there a way to do a data break-down between organic and Apple Search Ads under the App Store Search source type?
Hi Joey,
Thanks for commenting! 🙂
As App Store Search also includes Apple Search Ads result, you can subtract the installs from your ASA panel and thus, get the pure installs from Search.
Hope this helps!
Is there a way to also track in-app events, such as purchases by source, more specifically Apple Search Ads as a source?
thank you, i am new to ASO App Store optimization, but still i dont understand what App SEO Off page optimization, can you please share some ideas more, this is my app rto related vehicle information search but send me mail if you have more strategy…